绘图
PyODPS DataFrame提供了绘图的方法。如果要使用绘图,需要 pandas 和 matplotlib 的安装。
接下来的例子都是在jupyter中运行。
>>> from odps.df import DataFrame
>>> iris = DataFrame(o.get_table('pyodps_iris'))
>>> %matplotlib inline
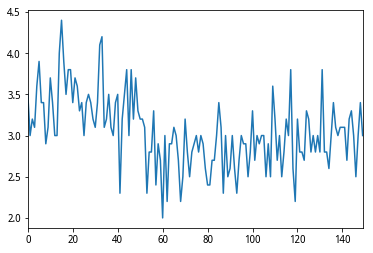
>>> iris.sepalwidth.plot()
<matplotlib.axes._subplots.AxesSubplot at 0x10c2b3510>
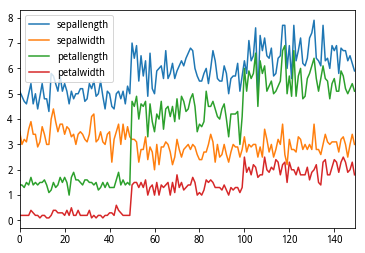
>>> iris.plot()
<matplotlib.axes._subplots.AxesSubplot at 0x10db7e690>
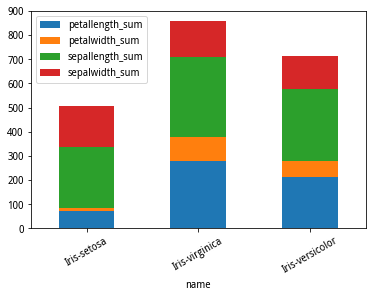
>>> iris.groupby('name').sum().plot(kind='bar', x='name', stacked=True, rot=30)
<matplotlib.axes._subplots.AxesSubplot at 0x10c5f2090>
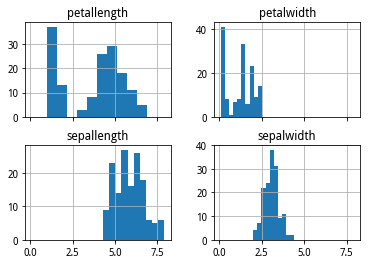
>>> iris.hist(sharex=True)
array([[<matplotlib.axes._subplots.AxesSubplot object at 0x10e013f90>,
        <matplotlib.axes._subplots.AxesSubplot object at 0x10e2d1c10>],
       [<matplotlib.axes._subplots.AxesSubplot object at 0x10e353f10>,
        <matplotlib.axes._subplots.AxesSubplot object at 0x10e3c4410>]], dtype=object)
参数kind表示了绘图的类型,支持的包括:
kind |
说明 |
|---|---|
line |
线图 |
bar |
竖向柱状图 |
barh |
横向柱状图 |
hist |
直方图 |
box |
boxplot |
kde |
核密度估计 |
density |
和kde相同 |
area |
|
pie |
饼图 |
scatter |
散点图 |
hexbin |
详细参数可以参考Pandas文档:http://pandas.pydata.org/pandas-docs/stable/generated/pandas.DataFrame.plot.html
除此之外,plot函数还增加了几个参数,方便进行绘图。
参数 |
说明 |
|---|---|
xlabel |
x轴名 |
ylabel |
y轴名 |
xlabelsize |
x轴名大小 |
ylabelsize |
y轴名大小 |
labelsize |
轴名大小 |
title |
标题 |
titlesize |
标题大小 |
annotate |
是否标记值 |