Plotting
PyODPS DataFrame provides plotting. To enable plotting, install the pandas and matplotlib libraries.
The following examples run in Jupyter:
>>> from odps.df import DataFrame
>>> iris = DataFrame(o.get_table('pyodps_iris'))
>>> %matplotlib inline
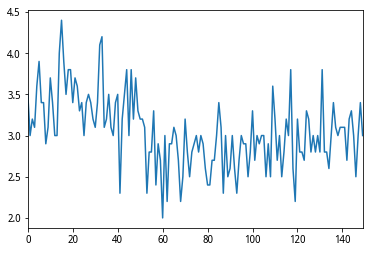
>>> iris.sepalwidth.plot()
<matplotlib.axes._subplots.AxesSubplot at 0x10c2b3510>
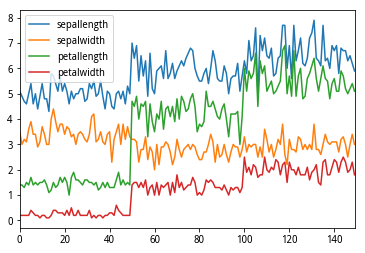
>>> iris.plot()
<matplotlib.axes._subplots.AxesSubplot at 0x10db7e690>
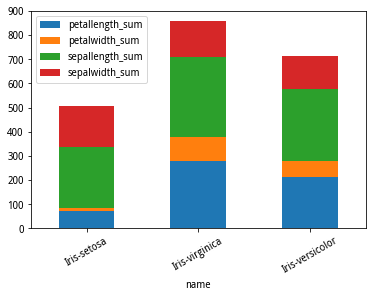
>>> iris.groupby('name').sum().plot(kind='bar', x='name', stacked=True, rot=30)
<matplotlib.axes._subplots.AxesSubplot at 0x10c5f2090>
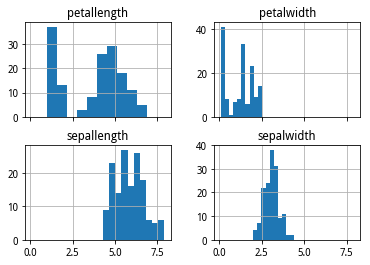
>>> iris.hist(sharex=True)
array([[<matplotlib.axes._subplots.AxesSubplot object at 0x10e013f90>,
        <matplotlib.axes._subplots.AxesSubplot object at 0x10e2d1c10>],
       [<matplotlib.axes._subplots.AxesSubplot object at 0x10e353f10>,
        <matplotlib.axes._subplots.AxesSubplot object at 0x10e3c4410>]], dtype=object)
The kindparameter specifies the plotting type, and supports the following types:
kind |
Description |
|---|---|
line |
Line chart |
bar |
Vertical bar chart |
barh |
Horizontal bar chart |
hist |
Histogram |
box |
Boxplot |
kde |
Kernel density estimation |
density |
Same as kernel density estimation |
area |
|
pie |
Pie chart |
scatter |
Scatter chart |
hexbin |
For more information, see pandas.DataFrame.plot: http://pandas.pydata.org/pandas-docs/stable/generated/pandas.DataFrame.plot.html
The plot function also provides the following parameters for plotting:
Parameter |
Description |
|---|---|
xlabel |
X axis name |
ylabel |
Y axis name |
xlabelsize |
Size of x axis name |
ylabelsize |
Size of y axis name |
labelsize |
Axis name size |
title |
Title |
titlesize |
Title size |
annotate |
Annotation |